Trip Advisor Dataset Analysis & Dashboard
Project details
Description
Objective:
For this project, my objective was to analyze and clean a dataset obtained from Trip Advisor and create an interactive dashboard using Tableau that would provide valuable insights to our client in a specific area. The client was looking for the best place to book for a couple of days, and my analysis would help shed light on the best hotels, when to book, what services to expect, and other pertinent information.
Methodology:
To achieve the objective, I performed extensive data cleaning and transformation to prepare the dataset for analysis. I utilized several advanced data analytics and visualization techniques to gain insights into the data. Once the data was clean and transformed, it was imported into Tableau, where I created an interactive dashboard that provided a comprehensive view of the hotel market in the area of interest.
Findings:
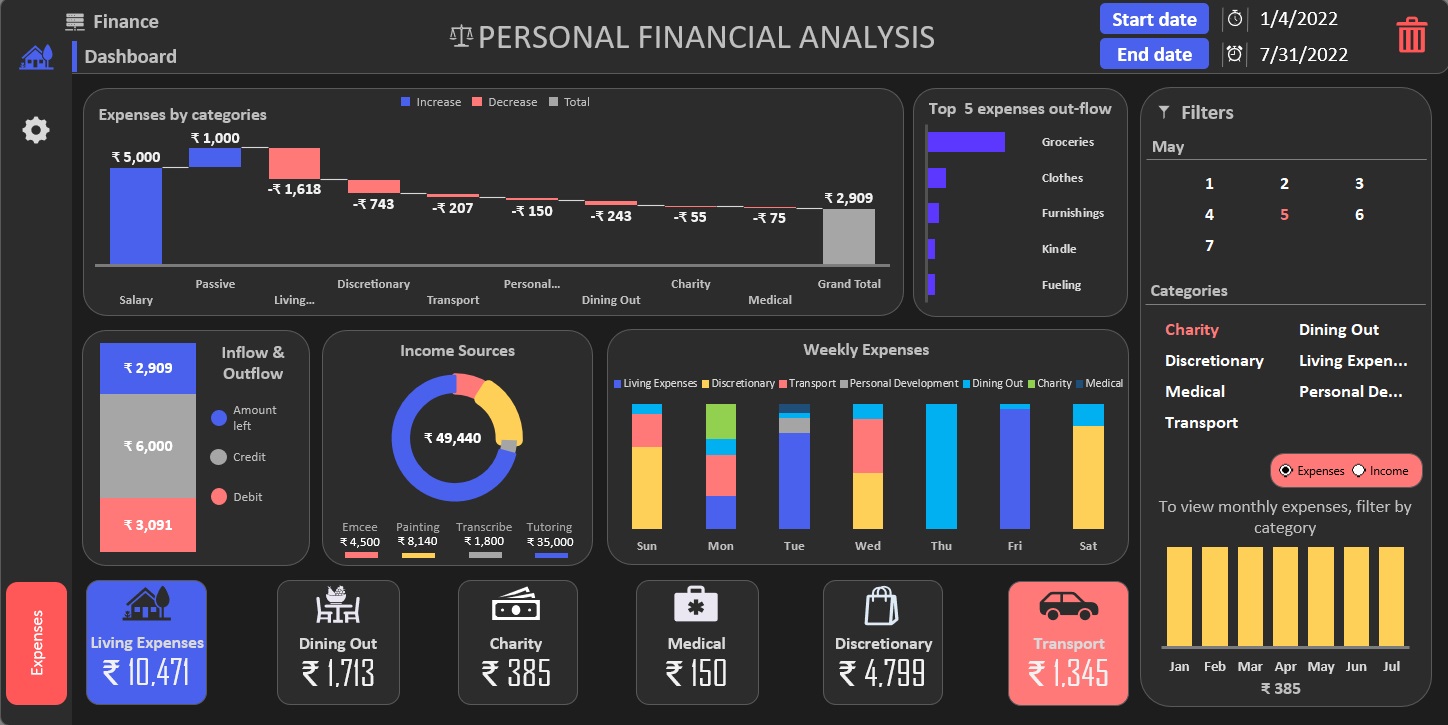
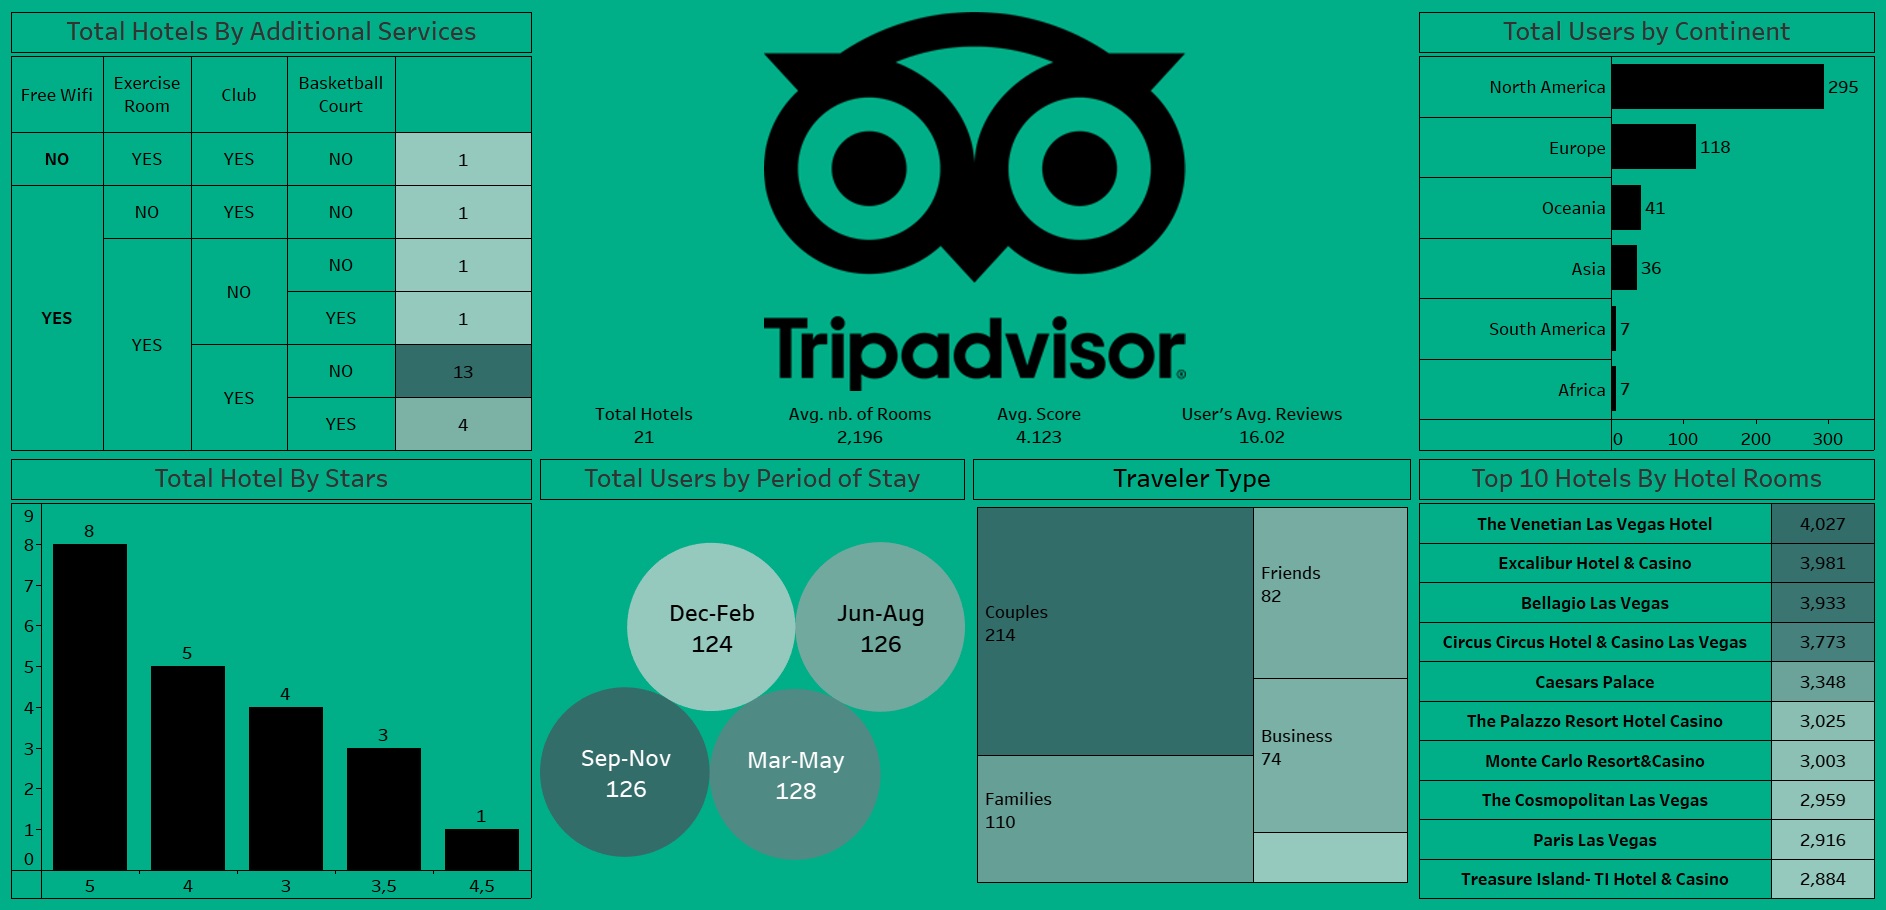
The interactive dashboard allowed users to quickly and easily view and analyze the dataset, providing valuable insights to our client. The dashboard included visualizations that showed total hotels by additional services, total hotels by stars, total users by period of stay, traveler type, total users by continent, and the top 10 hotels by hotel rooms. The main KPIs used were total hotels, average number of rooms, average score, and user's average reviews.
The dashboard was insightful, allowing users to identify the best hotels in the area, determine the most popular travel periods, and understand what services and amenities to expect from the different hotels. The client was able to make data-driven decisions regarding the best place to book for a couple of days, based on the insights gained from the dashboard.
Conclusion:
In conclusion, this project analyzed and cleaned a dataset obtained from Trip Advisor and created an interactive dashboard using Tableau that provided valuable insights to our client in a specific area. The dashboard was designed to be user-friendly, intuitive, and insightful, providing users with a comprehensive view of the hotel market in the area of interest. The main KPIs used were total hotels, average number of rooms, average score, and user's average reviews. The dashboard was found to be incredibly insightful, providing our client with a deeper understanding of the hotel market in the area, and allowing them to make data-driven decisions.
Other Projects