Netflix Interactive & Informative Dashboard
Project details
Description
Objective:
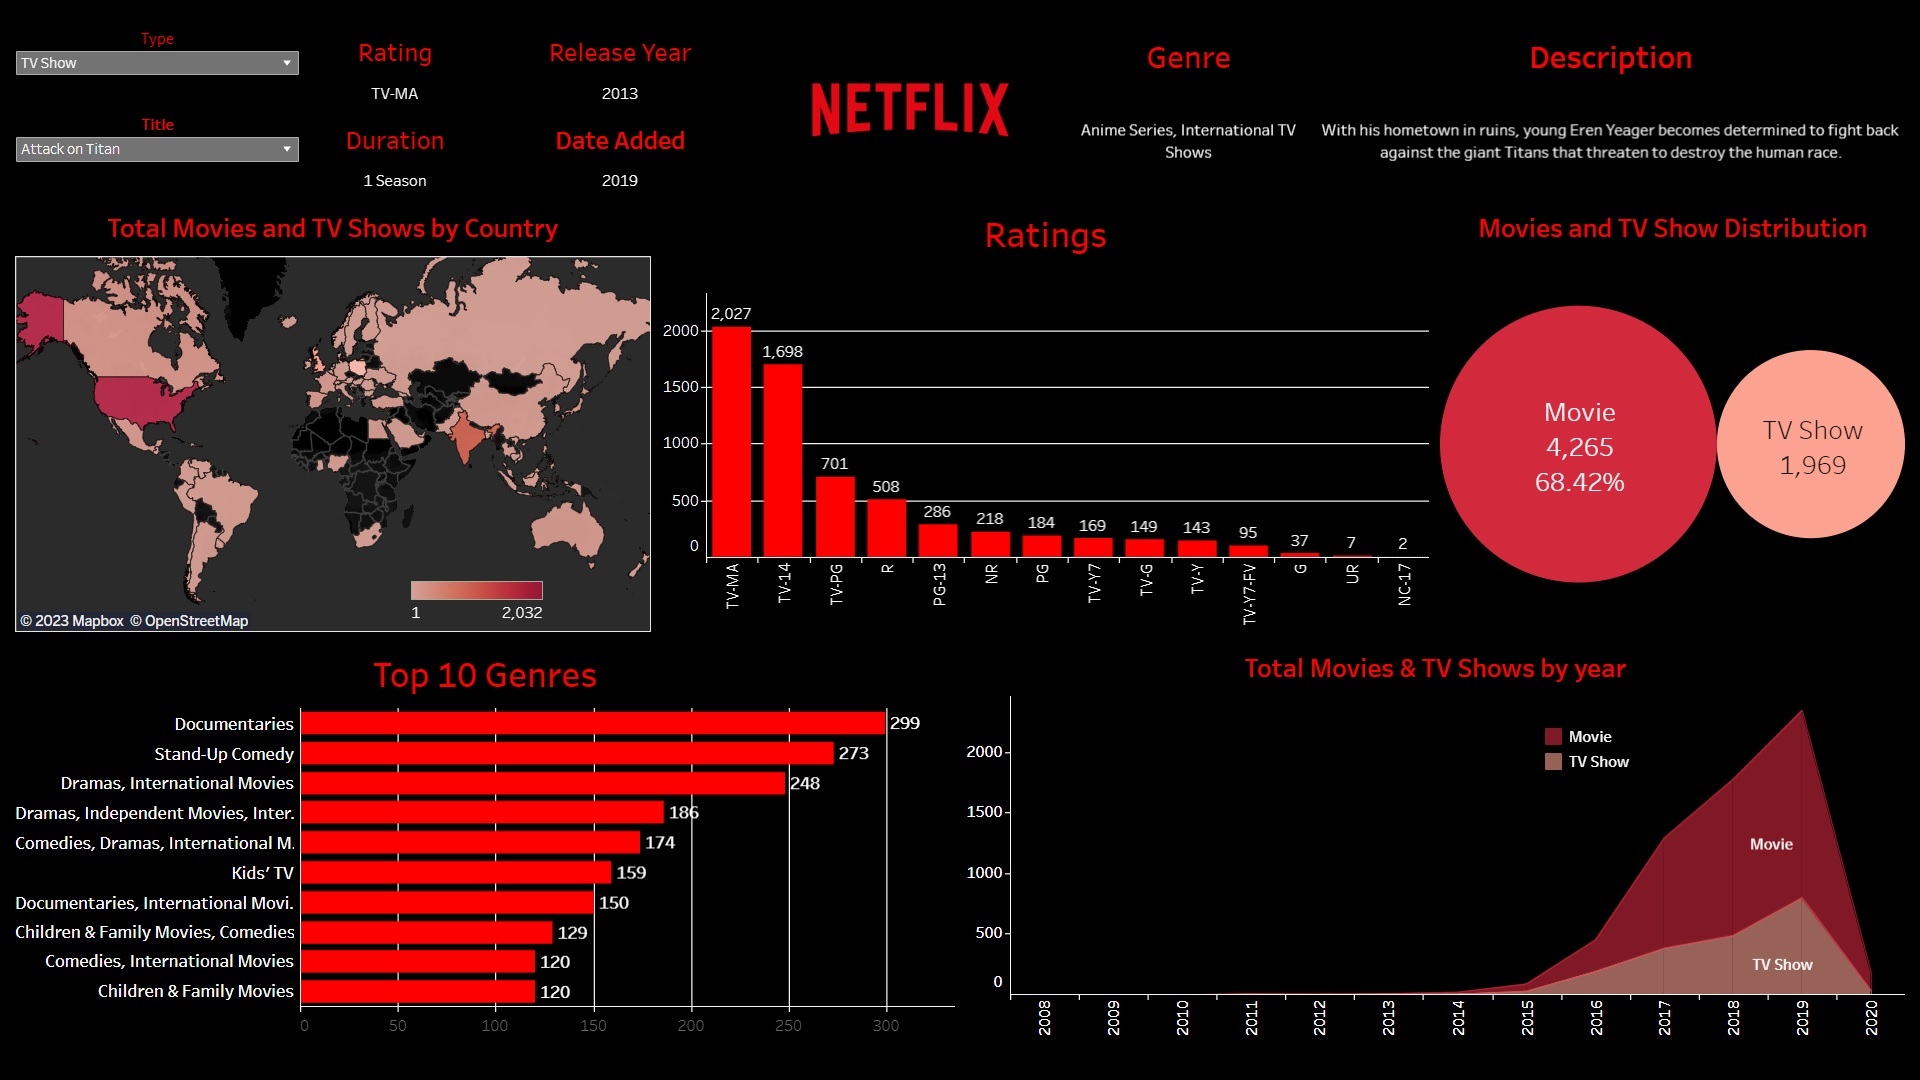
My objective for this project was to create an interactive Netflix dashboard using Tableau. The aim was to allow users to easily browse through Netflix's vast collection of movies and TV shows, and gain valuable insights into the content and its distribution.
Methodology:
To achieve this goal, I conducted extensive data cleaning and transformation using advanced SQL techniques. This was essential to prepare the data for analysis. Once the data was cleaned, I imported it into Tableau and created various visualizations to provide a comprehensive view of the content available on Netflix. The dashboard was designed to be user-friendly, with two primary buttons to select between movies and TV shows and corresponding media.
Findings:
The interactive dashboard I developed allowed users to quickly and easily view and analyze Netflix's vast collection of movies and TV shows. The dashboard included a global map showing the total number of movies and TV shows available in each country. It also featured a horizontal bar chart showcasing the top 10 genres on Netflix, and a visualization of the total movies and TV shows by year. Furthermore, it showed the distribution of movies and TV shows in Netflix's catalog and media distribution by rating. The dashboard was found to be incredibly insightful, providing users with a deeper understanding of Netflix's content distribution and allowing them to make data-driven decisions.
Conclusion:
In conclusion, I was able to create an interactive Netflix dashboard using Tableau that allowed users to gain valuable insights into the vast content available on the platform. The dashboard was designed to be user-friendly, intuitive, and insightful, providing users with a deeper understanding of the media's distribution on Netflix. Based on my findings, there are several enhancements that could further improve the dashboard's usefulness and relevance. Overall, I am proud of the success of the project and the valuable tool I created for users to explore and analyze Netflix's media offerings.
Other Projects