E-Commerce Sales Analysis

Project details
Description
In their annual sales review meeting, Kmart, one of the largest online retailers in the US, must decide on their sales strategy for 2020 based on insights from the 2019 sales data. This project focuses on generating key insights regarding Kmart's sales for each month of 2019. The data will be used to assist Kmart's sales team in fine-tuning sales strategies as the year progresses.
Tools Used: Jupyter Notebook is used as IDE. Among the Python libraries, Pandas is used for handling and preprocessing data. Plotly, Seaborn, and Matplotlib are used for visualizing plots..
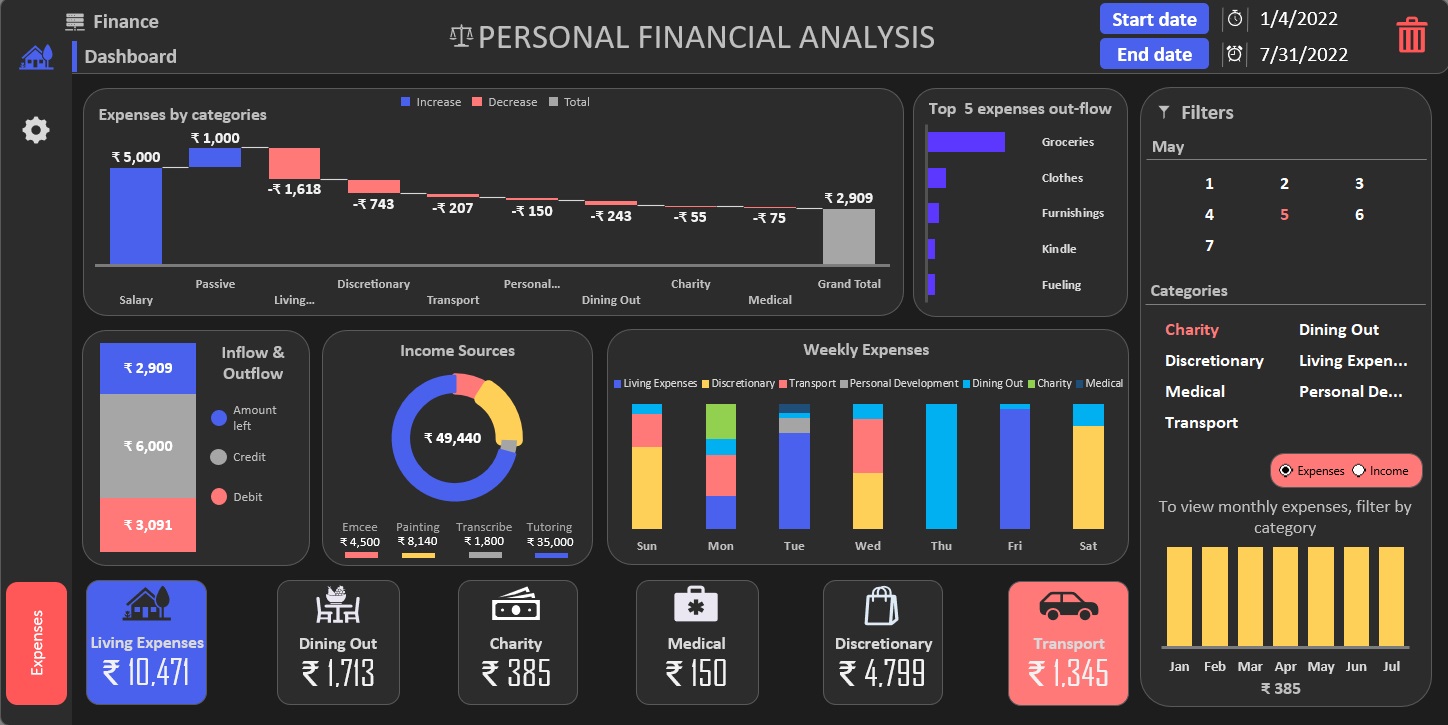
Conclusion: The analysis above clearly illustrates that month 12 (December) boasts the maximum sales in 2019 with roughly $9,226,886.
According to the graph, San Francisco has the largest number of sales.
The optimum time to display advertising to increase the probability of buyers purchasing the product/s is shortly before 12 pm and/or right before 7 pm.
The top selling product is 'AAA Batteries (4-pack)'. The top selling products seem to have a correlation with the price of the product. The cheaper the product, higher the quantity ordered and vice versa..
Please refer to the Github Repository for this project "here"
-
Technology Used:
Python, Jupyter -
Status:
Completed -
Project:
Link
Other Projects